How My Printer Caused Excessive Syscalls & UDP Traffic
5 Nov 2014
3,000 syscalls a second, on an idle machine? That doesn’t seem right. I just booted this machine. The only processes running are those required to boot the SmartOS Global Zone, which is minimal.
SmartOS # vmstat 1
kthr      memory            page            disk          faults      cpu
r b w   swap  free  re  mf pi po fr de sr lf rm s0 s1   in   sy   cs us sy id
0 0 0 10318200 1975496 2 31 0  0  0  0  2  0 -19858 0 18 3521 3879 2034 0 1 99
0 0 0 9169648 832932 2  52  0  0  0  0  0  0  0  0  0 3368 3741 2010  0  0 100
0 0 0 9169512 832796 0  14  0  0  0  0  0  0  0  0  0 3363 3814 2037  0  0 100
0 0 0 9169504 832788 0   2  0  0  0  0  0  0  0  0  3 3591 3854 2456  0  0 99
0 0 0 9169504 832788 0   2  0  0  0  0  0  0  0  0  0 3415 3820 2040  0  0 100
0 0 0 9169504 832788 0   2  0  0  0  0  0  0  0  0  0 3323 3753 2009  0  0 100
Well, at least I have DTrace. I can use this one-liner to figure out what syscalls are being made across the entire system.
SmartOS # dtrace -n 'syscall:::entry { @[probefunc,probename] = count(); }'
dtrace: description 'syscall:::entry ' matched 230 probes
^C

  fstat                                                             1
  mmap                                                              1
  schedctl                                                          1
  sigpending                                                        1
  nanosleep                                                         3
  pset                                                              3
  read                                                              3
  sysconfig                                                         3
  sigaction                                                         4
  sendto                                                            5
  brk                                                               6
  sigsuspend                                                        9
  recvfrom                                                          10
  setcontext                                                        10
  lwp_park                                                          12
  write                                                             15
  gtime                                                             18
  p_online                                                          256
  recvmsg                                                           709
  ioctl                                                             1087
  pollsys                                                           1436
  lwp_sigmask                                                       2876
Wow! That is a lot of lwp_sigmask calls.
Now that I know what is being called, it’s time to
find out who is doing the calling? I’ll use another
one-liner to show me the most common user stacks
invoking lwp_sigmask.
SmartOS # dtrace -n 'syscall::lwp_sigmask:entry { @[ustack()] = count(); }'
dtrace: description 'syscall::lwp_sigmask:entry ' matched 1 probe
^C
              … ouput ellided to save space …

              libc.so.1`syscall+0x13
              libc.so.1`thr_sigsetmask+0x1c2
              libc.so.1`sigprocmask+0x52
              sshd`collect_children+0x2a
              sshd`server_loop2+0x1a5
              sshd`do_authenticated2+0xe
              sshd`do_authenticated+0x33
              sshd`main+0x14cd
              sshd`_start+0x83
                5

              libc.so.1`syscall+0x13
              libc.so.1`thr_sigsetmask+0x1c2
              libc.so.1`sigprocmask+0x52
              mdnsd`mDNSPosixRunEventLoopOnce+0x122
              mdnsd`MainLoop+0xc2
              mdnsd`main+0xc3
              mdnsd`_start+0x83
              900

              libc.so.1`syscall+0x13
              libc.so.1`thr_sigsetmask+0x1c2
              libc.so.1`sigprocmask+0x52
              mdnsd`mDNSPosixRunEventLoopOnce+0x14e
              mdnsd`MainLoop+0xc2
              mdnsd`main+0xc3
              mdnsd`_start+0x83
              900
Okay, so this mdnsd code is causing all the trouble. What is the distribution of syscalls for the mdnsd program?
SmartOS # dtrace -n 'syscall:::entry /execname == "mdnsd"/ { @[probefunc] = count(); } tick-1s { exit(0); }'
dtrace: description 'syscall:::entry ' matched 231 probes
CPU     ID                    FUNCTION:NAME
  9  66110                         :tick-1s

  recvmsg                                                           200
  pollsys                                                           400
  lwp_sigmask                                                       800
Lots of signal masking and polling. What the hell! Why is it doing this? What is mdnsd anyways? Is there a man page? I switch tabs to my OmniOS machine because I don’t have the whatis database on my SmartOS Global Zone.
OmniOS $ man -k mdns
dns-sd(1m)               - Multicast DNS (mDNS) & DNS Service Discovery (DNS-SD) Test Tool
I open the dns-sd(1M) manual. It is a tool for
probing Multicast DNS (mDNS) and DNS Service Discovery.
Googling for mdns reveals that it is used for resolving
host names in small networks, like my home network. It uses
UDP, and requires zero configuration. Nothing obvious to
explain why it’s flipping out. I feel helpless. I turn to
the only thing I can trust, the code.
static mStatus  MainLoop(mDNS *m) // Loop until we quit.
    {
    sigset_t    signals;
    mDNSBool    gotData = mDNSfalse;

    mDNSPosixListenForSignalInEventLoop(SIGINT);
    mDNSPosixListenForSignalInEventLoop(SIGTERM);
    mDNSPosixListenForSignalInEventLoop(SIGUSR1);
    mDNSPosixListenForSignalInEventLoop(SIGPIPE);
    mDNSPosixListenForSignalInEventLoop(SIGHUP) ;

    for (; ;)
        {
        // Work out how long we expect to sleep before the next scheduled task
        struct timeval  timeout;
        mDNSs32         ticks;

        // Only idle if we didn't find any data the last time around
        if (!gotData)
            {
            mDNSs32         nextTimerEvent = mDNS_Execute(m);
            nextTimerEvent = udsserver_idle(nextTimerEvent);
            ticks = nextTimerEvent - mDNS_TimeNow(m);
            if (ticks < 1) ticks = 1;
            }
        else    // otherwise call EventLoop again with 0 timemout
            ticks = 0;

        timeout.tv_sec = ticks / mDNSPlatformOneSecond;
        timeout.tv_usec = (ticks % mDNSPlatformOneSecond) * 1000000 / mDNSPlatformOneSecond;

        (void) mDNSPosixRunEventLoopOnce(m, &timeout, &signals, &gotData);

        if (sigismember(&signals, SIGHUP )) Reconfigure(m);
        if (sigismember(&signals, SIGUSR1)) DumpStateLog(m);
        // SIGPIPE happens when we try to write to a dead client; death should be detected soon in request_callback() and cleaned up.
        if (sigismember(&signals, SIGPIPE)) LogMsg("Received SIGPIPE - ignoring");
        if (sigismember(&signals, SIGINT) || sigismember(&signals, SIGTERM)) break;
        }
    return EINTR;
    }
Woah boy, this is some messy looking code. This would not pass
illumos cstyle checks. Turns out this is code from Darwin—the
kernel of OSX. That explains the references to Safari and
Bonjour in the dns-sd(1M) page. I move on.
From the previous stack trace, I know
that mDNSPosixRunEventLoopOnce is the hot
function. It consists of a tight loop, running until
a SIGINT or SIGTERM is sent. There
is a timeout variable passed to this function. I
bet that has something to do with my problem. What is the
distribution of values for this variable?
SmartOS # dtrace -p 2129 -n 'pid$target::mDNSPosixRunEventLoopOnce:entry { self->tv = (struct timeval*)copyin(arg1, sizeof(void*)); @[self->tv->tv_sec, self->tv->tv_usec] = count(); } tick-1s { exit(0); }'
dtrace: description 'pid$target::mDNSPosixRunEventLoopOnce:entry ' matched 2 probes
CPU     ID                    FUNCTION:NAME
  6  66110                         :tick-1s

 4290771112951812                0                1
                5                0              196
                0                0              261
What the fuck is 4290771112951812 all
about? Is that a bug in the code? I dunno, but it’s not my
concern right now. I’m having the opposite problem, no
sleeping at all. The output indicates a fairly even split
between a timeout of 0 and 5 seconds. I go back and study the
code for a minute, coming away with two observations.
-
The
timeoutis set 0 whengotDatais true. -
Even when
timeoutis set to 5 seconds the call returns immediately. It couldn’t run over 400 times a second otherwise.
I’m going to have to look at the code
for mDNSPosixRunEventLoopOnce to figure this one
out.
// Do a single pass through the attendent event sources and dispatch any found to their callbacks.
// Return as soon as internal timeout expires, or a signal we're listening for is received.
mStatus mDNSPosixRunEventLoopOnce( mDNS *m, const struct timeval *pTimeout,
                                    sigset_t *pSignalsReceived, mDNSBool *pDataDispatched)
    {
    fd_set          listenFDs = gEventFDs;
    int             fdMax = 0, numReady;
    struct timeval  timeout = *pTimeout;

    // Include the sockets that are listening to the wire in our select() set
    mDNSPosixGetFDSet( m, &fdMax, &listenFDs, &timeout);    // timeout may get modified
    if ( fdMax < gMaxFD)
        fdMax = gMaxFD;

    numReady = select( fdMax + 1, &listenFDs, (fd_set*) NULL, (fd_set*) NULL, &timeout);

    // If any data appeared, invoke its callback
    if ( numReady > 0)
        {
        PosixEventSource    *iSource;

        (void) mDNSPosixProcessFDSet( m, &listenFDs);   // call this first to process wire data for clients

        for ( iSource=(PosixEventSource*)gEventSources.Head; iSource; iSource = iSource->Next)
            {
            if ( FD_ISSET( iSource->fd, &listenFDs))
                {
                iSource->Callback( iSource->Context);
                break;  // in case callback removed elements from gEventSources
                }
            }
        *pDataDispatched = mDNStrue;
        }
    else
        *pDataDispatched = mDNSfalse;

    (void) sigprocmask( SIG_BLOCK, &gEventSignalSet, (sigset_t*) NULL);
    *pSignalsReceived = gEventSignals;
    sigemptyset( &gEventSignals);
    (void) sigprocmask( SIG_UNBLOCK, &gEventSignalSet, (sigset_t*) NULL);

    return mStatus_NoError;
    }
In this function gotData is renamed
to pDataDispatched. If select(3C)
finds any ready descriptors this flag will be set to true. At
the end of the function are the lwp_sigmask
(sigprocmask maps to lwp_sigmask)
calls that initially caused my investigation.
So MainLoop
calls mDNSPosixRunEventLoopOnce in a tight loop,
which is essentially just a select call. This explains the
large timeout value, which causes it to act like a blocking
read. When passed a timeout of 0, it acts as a poll. The
only thing to keep this loop from eating the CPU is passing a
non-zero timeout when no data is ready to be read. I already
know that is not happening by virtue of the fact that this
function is executed hundreds of times a second.
Hmmm…I wonder…I wonder if my MacBook is also experiencing abnormal syscall rates? Nooo, that can’t be it. Why would both my SmartOS server and MacBook both have the same problem? There is no good technical reason to link these two. But, then again, I’m dealing with computers here, and I’ve seen a lot of strange things over the years. I switch to my laptop.
MacBook $ sudo dtrace -n 'syscall::: { @[execname] = count(); } tick-1s { exit(0); }'
dtrace: description 'syscall::: ' matched 981 probes
CPU     ID                    FUNCTION:NAME
  4 304653                         :tick-1s

  notifyd                                                          13
  syslogd                                                          15
  CIJScannerRegis                                                  16
  ntpd                                                             16
  WindowServer                                                     18
  fseventsd                                                        20
  dtrace                                                           24
  iTerm                                                            98
  iTunes                                                          461
  coreaudiod                                                      842
  Google Chrome                                                   956
  discoveryd                                                     1974
  Google Chrome H                                                4884
What the hell? I ignore Google Chrome Helper as I’m pretty
sure it’s not related. But next in
line, discoveryd, looks very suspicious. It
doesn’t have mdns in the name, but a) it is making a lot of
syscalls, b) the word discovery has a lot to do with DNS and
c) it ends in ‘d’, indicating it is probably a daemon. Sure
enough, the first google result for “discoveryd” is a thread
stating that mDNSResponder was replaced
with discoveryd in OSX Yosemite.
Perhaps Yosemite is causing all my pain? I ask my friend Steve Vinoski to run the same DTrace one-liner on his OSX machines. He has both Yosemite and the older Mountain Lion. But, to my dismay, neither of his machines are exhibiting high syscall rates. My search continues.
Not sure what to do next, I open the OSX Activity Monitor. In desperation I click on the Network tab.
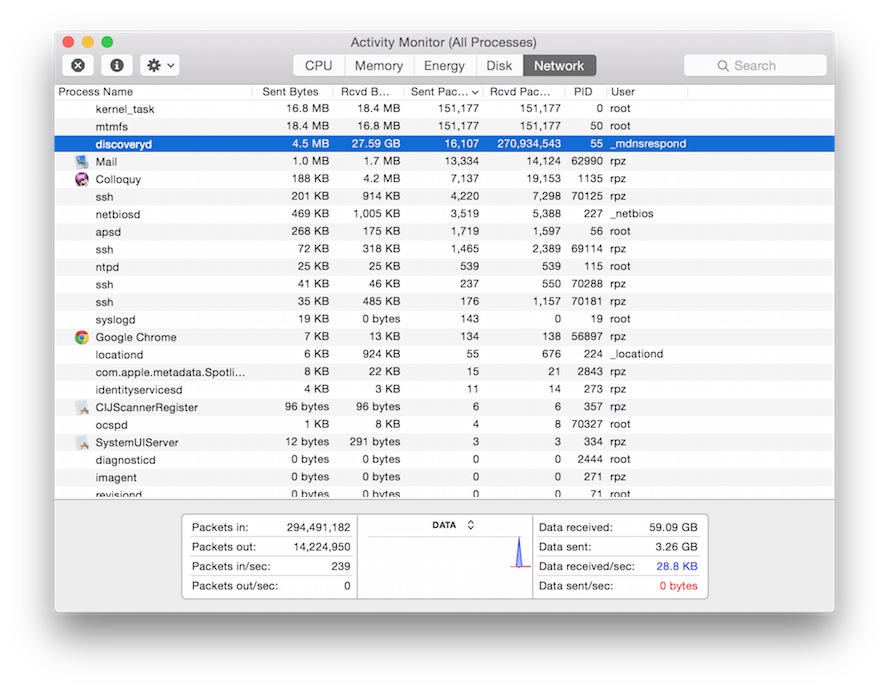
HOLE—E—SHIT! Two-Hundred-and-Seventy Million packets
received by discoveryd. Obviously I can stop
looking at code and start looking at my network. I hop back
onto my SmartOS machine and check network interface
statistics.
SmartOS # netstat -i
Name    Mtu  Net/Dest      Address        Ipkts   Ierrs Opkts  Oerrs Collis Queue
lo0     8232 loopback      localhost      115     0     115    0     0      0
e1000g0 1500 XXX.local     XXX.local      3420655 0     10303  0     0      0
lo0     8252 localhost     localhost      115     0     115    0     0
In only a few hours, my idle SmartOS server has received over three million packets. How many packets are coming in every second?
SmartOS # dladm show-link -s -i 1 e1000g0
LINK           IPACKETS  RBYTES  IERRORS   OPACKETS    OBYTES      OERRORS
e1000g0        3458412   438890273 0       10362       1787638     0
e1000g0        209       26486   0         2           364         0
e1000g0        209       26486   0         1           182         0
e1000g0        205       25978   0         1           182         0
e1000g0        211       26740   0         1           182         0
Whatever is causing all this, it is sending about 200 packets
a second. At this point, the only thing left to do is
actually inspect some of these incoming packets. I
run snoop(1M) to collect events on
the e1000g0 interface, stopping at about 600
events. Then I view the first 15.
SmartOS # snoop -ri /opt/snoop.out | head -15
      … first three events ellided …
 4   0.00914     10.0.1.8 -> 224.0.0.251  MDNS R A1CA45000000.local. Internet Addr 10.0.1.8
 5   0.00479     10.0.1.8 -> 224.0.0.251  MDNS R A1CA45000000.local. Internet Addr 10.0.1.8
 6   0.00243     10.0.1.8 -> 224.0.0.251  MDNS R A1CA45000000.local. Internet Addr 10.0.1.8
 7   0.00477     10.0.1.8 -> 224.0.0.251  MDNS R A1CA45000000.local. Internet Addr 10.0.1.8
 8   0.00411     10.0.1.8 -> 224.0.0.251  MDNS R A1CA45000000.local. Internet Addr 10.0.1.8
 9   0.00194     10.0.1.8 -> 224.0.0.251  MDNS R A1CA45000000.local. Internet Addr 10.0.1.8
10   0.00229     10.0.1.8 -> 224.0.0.251  MDNS R A1CA45000000.local. Internet Addr 10.0.1.8
11   0.00223     10.0.1.8 -> 224.0.0.251  MDNS R A1CA45000000.local. Internet Addr 10.0.1.8
12   0.00446     10.0.1.8 -> 224.0.0.251  MDNS R A1CA45000000.local. Internet Addr 10.0.1.8
13   0.00307     10.0.1.8 -> 224.0.0.251  MDNS R A1CA45000000.local. Internet Addr 10.0.1.8
14   0.00234     10.0.1.8 -> 224.0.0.251  MDNS R A1CA45000000.local. Internet Addr 10.0.1.8
15   0.00385     10.0.1.8 -> 224.0.0.251  MDNS R A1CA45000000.local. Internet Addr 10.0.1.8
A constant stream of mDNS packets arriving from
IP 10.0.1.8. I know that this IP is not any of
my computers. The only devices left are my iPhone, AppleTV,
and Canon printer.
Wait a minute! The printer! Two days earlier I heard some beeping noises…
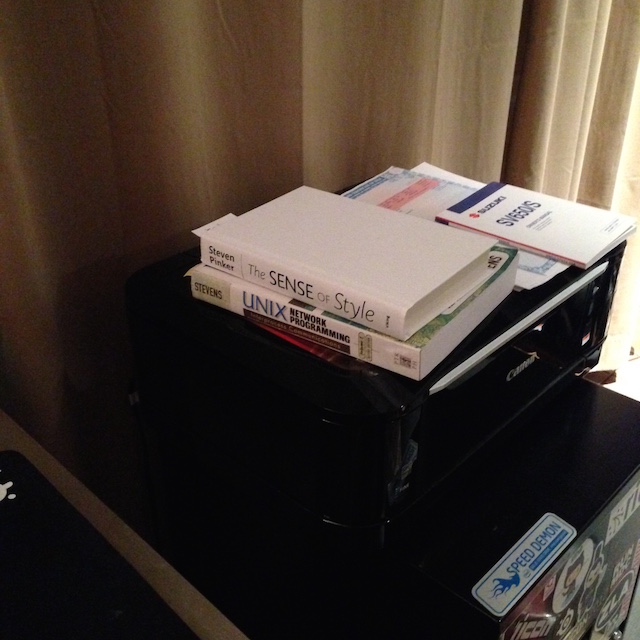
I own a Canon PIXMA MG6120 printer. It has a touch interface with a small LCD at the top, used to set various options. Since it sits next to my desk I sometimes lay things on top of it like a book or maybe a plate after I’m done eating. If I lay things in the wrong place it will activate the touch interface and cause repeated pressing. Each press makes a beeping noise. If the object lays there long enough the printer locks up and I have to reboot it. Just such events occurred two days earlier.
I fire up dladm again to monitor incoming packets
in realtime. Then I turn to the printer. I move all the crap
off of it: two books, an empty plate, and the title for my
Suzuki SV650 that I’ve been meaning to sell for the last year.
I try to use the touch screen on top of the printer. It’s
locked up, as expected. I cut power to the printer and whip
my head back to my terminal.
SmartOS # dladm show-link -s -i 5 e1000g0
LINK           IPACKETS  RBYTES  IERRORS   OPACKETS    OBYTES      OERRORS
e1000g0        3606738   457696120 0       10868       1870150     0
e1000g0        2023      256738  0         3           473         0
e1000g0        1960      248800  0         1           182         0
e1000g0        1895      240482  0         1           182         0
e1000g0        1867      236910  0         1           182         0
e1000g0        1878      238386  0         1           182         0
e1000g0        552       69801   0         1           182         0
e1000g0        5         392     0         1           182         0
e1000g0        6         456     0         1           182         0
I run DTrace again to count syscalls.
SmartOS # dtrace -n 'syscall:::entry { @[execname] = count(); } tick-1s { exit(0); }'
dtrace: description 'syscall:::entry ' matched 231 probes
CPU     ID                    FUNCTION:NAME
  6  66110                         :tick-1s

  devfsadm                                                          2
  ipmon                                                             2
  ntpd                                                              6
  lldpd                                                             7
  dtrace                                                          547
I’m not sure whether to laugh or cry. I laugh, because, LOL computers. There’s some new dumb shit you deal with everyday, better to roll with the punches and laugh. You live longer that way. At least I got to flex my DTrace muscles a bit. In fact, I felt a bit like Brendan Gregg when he was debugging why OSX was dropping keystrokes.
I didn’t bother to root cause why my printer turned into a UDP machine gun. I don’t intend to either. I have better things to do, and if rebooting solves the problem then I’m happy. Besides, I had to get back to what I was trying to do six hours before I started debugging this damn thing.